<img alt="" src="https://secure.leadforensics.com/211043.png" style="display:none;">

ERDOS MILLER

PRODUCT TRAINING

YouTube Playlist


ERDOSMILLER CERTIFICATION - LEVEL 1

This certification provides the essential knowledge and skills required to operate ErdosMiller tools effectively in the field. It includes detailed information, step-by-step instructions, and practical examples to support the application of concepts in field operations.

Topics covered include WITS, Mud Pulse Signal Troubleshooting, MicroPulse Features, Memory Files Management, Configuration and Testing, LocalSync and Connectivity, and Eclipse Touch Features. Users are expected to review each section carefully and follow the outlined procedures to ensure proper tool operation and field performance.

Request the Certification Course below:


WITS

What is WITS?

Wellsite Information Transfer Specification. This 4-digit format is used to transfer real time data from drilling operations to a central database. This data is used for MWD and Rig EDR information to share data.

Why WITS is important?

This data is crucial for monitoring and optimizing drilling performance, Gamma plotting and sending real time data between systems.

Where to access WITS in Eclipse Touch

WITS Is located at the top of the live page. This will give you access to create WITS channels.


WITS MAIN PAGE

WITS CHANNEL PAGE

If you would like Eclipse Touch to create WITS logs for outgoing data, Enable File Logging. You can create a WITS channel using “Create From File” this will allow the user to bring in a WITS file that has the correct mapping and variables from a previous file. To add a channel (if sending to multiple systems) click the “+” and a new channel will appear.


“DIAG” or Diagnostic Window, will allow the user to see the inbound and outbound traffic of that channel in real time.

“Stop” Will close all communication on that channel. Both inbound and outbound traffic.

“Edit” will allow to edit the channel name, ID’s Tags, Port selection, Confidence Threshold, Traffic warning.

“Trash Bin Icon” Deletes the channel


DIAGNOSTICS PAGE


Diagnose the Inbound and outbound traffic by looking at the 4 Digit WITS ID followed by the value that was transmitted with the WITS ID.

WITS ID – is a 4 Digit number, it’s what the variable identifies as. It must be the same across all systems for them to display the values correctly.

WITS Tag – is the name associated with the WITS ID. This doesn’t have to be the same across systems.


Manually Send a variable – You can do this on the right side of the screen of the Diagnostics Window.

The variable will have the WITS ID to the right of the Tag. You can click on the value to edit and send a custom value. By clicking “Send” it will send that value on that WITS ID channel. This is extremely helpful when troubleshooting communications between systems.


EDIT WITS CHANNEL

This page allows the user to set a custom Name for the WITS Channel.


Channel Name (1) – Allows the user to make custom names for each channel (useful when you are communicating with multiple systems)

Confidence threshold (2) – Setting a threshold, any decode below this threshold will not be sent out via WITS.

Traffic Warning (3,4) – This setting is to illuminate a warning on the live page if WITS traffic has stopped for a specified amount of time from inbound traffic. The time interval will be determined by Traffic Warning Interval (4).

Port Selection (5)- is for selecting which port you will be communicating with for this channel. (this will be a drop down window with the available serial ports that Eclipse Touch recognizes). If you do not see your port, check network settings and serial com ports.

Save -If this set up is something that you will continue to use for a future well, you can save this file on your desktop for future use. It will save all the settings along with the channel name. All settings can be changed while drilling ahead.


MAPPING TAB


Mapping Section – this section allows you to edit WITS ID’s (3) and Tag Names (4).

Input Map (1) – The inbound WITS section. Eclipse Touch will take in any inbound WITS from other programs, you can edit the WITS ID (3) to match what other systems are using. The Tag name (4) can be specified for how you would like to record the data in Eclipse Touch. Specific inbound tags are mapped to the LIVE surface data indicators. (Hole Depth, RPM, ROP)

Output Map (2) – Decoded Data can be sent out via WITS. When starting a new WITS channel, there will be default settings already set up for this channel. The user can edit any of the variables to change the WITS ID (3) to match other systems. If you are running certain babelfish or RSS variables, they can be sent out via WITS by hitting the (+) icon and adding an unused WITS ID (3), the Tag Name (4) must match the decoded name on the decode pane of the live screen in order to send out correctly.

Notes – You can always go back to default inputs / outputs to start back over. You can only use one 4 digit WITS ID (3) for a variable. It cannot be used for multiple variables. Semicolons ( ; ) are used to separate WITS packets, so if variables are not being sent until the end of a sequence, check to see if semicolons are being used correctly. You will need a semicolon after each sequence variable if you want them sent out as they are decoded. For example, if you are using Azimuthal Gamma, you DO NOT want to use the semicolon between the up, down left right vectors so that the reading is taken from the same spot. If you have two toolface Numonics back to back, you will want to use a semicolon to separate the two variables.

Troubleshooting Tips - When running into issues with WITS, it’s important to understand whether it is a single value not WITSing over or if you lost total communication from a certain system. If it’s a single WITS value not being sent, check the diagnostic window in ET to troubleshoot. See if the value is going through. If it is, look at the WITS ID and check the next system to verify that the WITS ID is the same, also check to make sure that ID isn’t being used by another program for a different variable. If total communication is lost, check your USB connection and verify which system has lost communication. Sometimes a simple reboot could fix the issue. Sometimes you will need to replace a serial cable, network settings or USB adapter.


MUD PULSE SIGNAL TROUBLESHOOTING

DECODES AND SURVEYS

  • Be sure to select decodes or surveys for proper viewing.
  • Double clicking surveys or clicking anywhere on the survey list will open the SRVY tab.
  • Double clicking the decodes title or clicking anywhere on the decodes list will open the full Decodes view.


How to read the Decodes Data Pane Window:

On the left you have the variable name eg. GTFA (Gravity Tool Face) and it’s decoded value of 5.6, the time stamp shows when that data was decoded. A quick look to the far right, shows how long ago the data point was decoded, 0s ago.

In the middle we have CONF, this stands for how confident the decoder is, that it decoded the data correctly, expressed in a percentage value. CONF colors will change as CONF drops, from Green, Yellow, Red.  

What’s SNR? SNR stands for signal to noise ratio. Simply put, the higher the number the better. You always want to have more tool signal vs noise, so the decoder can perform at it’s optimum level. With that being said, just because the SNR drops doesn’t mean so will the CONF, the decoder does a great job of filtering out the noise.

AVP: Stands for the average pulse amplitude, this is the size of the pulse in PSI.

  • Note: When looking over this window, all the data should be reviewed together to ensure, that you the operator may correctly interpret what the data is telling you.

How to export and filter decoded data:

1st To view a larger window of decoded data, double click on decodes in the top left or click anywhere in the decodes window to see the display larger.

Exporting decoded data, open the large decodes window and select the export button, save to desired location.

To Filter the decoded data, you may click the symbol name or value and select filter or show. You may also click on filter setup and check or uncheck the boxes to be shown or filtered out.


FFT / SPECTROGRAM

So what is an FFT Spectrogram?

A spectrogram is a visual representation of the spectrum of frequencies in a signal as they vary over time. It’s like a musical portrait, revealing how different frequencies contribute to a sound. Let’s break it down:

  • Format: A spectrogram is usually depicted as a heat map, where the intensity is shown by varying color or brightness. Imagine a graph with two geometric dimensions.
    • Time on the y-axis.
    • Frequency on the x-axis.
    • The amplitude of a particular frequency at a specific time is represented by the intensity or color of each point in the image.

FFT


Why should you use it? 

  • The FFT is your best tool for troubleshooting rig noise that interferes with the software decoding.
  • It identifies the possible source of the interfering noise.
  • Eliminates or reduces nonproductive time NPT.

Where and how can I find the FFT/Spectrogram in the Eclipse Touch software?

  • To find the FFT/Spectrogram
  • Open Eclipse Touch make sure your on the Live page tab, look down at the bottom of the window.  
  • Next: Click on the pulse train 

  • Finally: Click on the tab labled FFT

  • If the rig is currently drilling and your tool is down hole you should see something like the below pic.

  • The buttons on the far right side of the screen allow you to navigate up and down, this allows you to view older data or whats presently being decoded.
  • If the view looks to dark or bright, click on the rescale button for a quick adjustment.
  • You may further adjust the color intensity left click and hold on the frequency magnitude bar, then slide up or down and everything will become brighter or darker. Sometimes this technique helps to identify noise.

So just what do all those colors mean and how to make sense of them all?

  • Below is a ideal pic of the FFT with all the noise sources identified and labeled for your reference. Please note these can vary a bit from rig to rig.
  • Pro Tip: Get to know your FFT signature whenever everything is running smoothly and whenever an issue occurs, you’ll spot it quickly.


Troubleshooting MWD signal 101 with the FFT

  • The best place to start troubleshooting with the FFT if you do not catch sync is to look for noise present at the same frequency as your tool, this will be between zero and one hertz. Open the FFT and scroll down to the start of the stand.


  • In this pic we have some electrical interference, this is broadband spectrum noise, meaning… It travels through all frequences, hence traveling all the way across the screen. The addition of a UPS (Universal Power Supply) with a built in power scrubber can help improve decoding when light electrical interference is encountered.


  • Here is another example of a transducer that is about to fail, it too is broadband spectrum noise and travels through all frequences.


  • If you are drilling along and suddenly decoding confidence drops off, you might see something like the below pic. Here we have pump induced noise, pump harmonics will stay at a given frequency for their present stroke rate. An increase in strokes and they increase in frequency, a decrease in strokes, and they decrease. Watch the FFT when the rig does slow pump rates, and it is obvious. A harmonic splitting into several others is a telltale sign a swab or something else in the pump is about to fail.


  • What is happening here? Everything is so bright! If you see this no need to panic, try clicking on the rescale button or left click and hold on the frequency magnitude bar while moving up or down to adjust the color intensity.


PLAYBACK

  • The playback feature is typically used for troubleshooting poor decoding, or if you just want to see how things looked in real time. Note: When choosing a stand file to playback choose the one with the earliest timestamp, it has the sync pulses the decoder needs to fully display the data.
  • To find the playback feature, click on the ET logo in the top right corner of the Live page. Next click Live or Quick.
  • For Live playback, click Live and then select the desired Excel CSV decoder log you wish to view. For quick navigation you may use the buttons on the left side.
  • Once you have selected your desired decoder log the window will close and you’ll be looking at the Live page, next wait to watch the pulses populate just like they do in real time.
  • To stop Live playback, click on the ET logo and click Stop Live.
  • For Quick Playback, click quick, then select file and navigate to the desired decoder log location, next click Start.
  • After clicking start ET will quickly load the log and display all the data points along with their value and decoder confidence percentage.


  • To play another log just click on the log file itself, in this case it’s S0234, then select your next file for playback and press start. Once you’re done, just click close at the bottom and you’ll be taken back to the live page. Note: When choosing a stand file to playback choose the one with the earliest timestamp, it has the sync pulses the decoder needs to fully display the data.


  • Note: After playing back a file you can still go back and view the pulse train, just click on View Plot, at the top of the page.
  • Also: If needed you may export the played back data, just click on Export, at the top of the page and save it to your desired location.


MANUAL SYNC

  • Why use Manual sync? It saves time because you do not have to cycle the pumps to sync back up on a new set of sync pulses!
  • When should manual sync be used? In cases when the decoder does not automatically sync up. Typically sync occurs before the 4 sync pulses pass over SRVY on the Live page.
  • How to use the Manual Sync feature? Just single click anywhere on the pulse train.

  • The History view will then pop up.
  • Double click the row with the sync pulses you want to sync on, and the Pulse Detail view will pop up.


  • Now in the pulse detail view, click on Manual Sync button, left side of the screen.


  • Use the left/right arrows to line up the red sync pulse template over the desired sync pulses, then press start.
  • Note: The pulses are not always picture perfect, the decoder typically syncs on nice ones. You may have pulses missing or distorted, if so, take a guess, multiple tries may be necessary to get it to sync up properly.  When in doubt line up your template on what you believe is the last of the 4 sync pulses and then click start.


  • Pro Tip: If the red template doesn’t line up over your pulses, you may need to change the PW to match. Use the -/+ buttons to change the PW of the template, then press start.
  • Accidental downlinks most often occur while tripping in the hole.


  • After pressing start, the Live page will appear with all the new data being played back as the decoder works to catch back up. Notice the time stamp on the decodes.
  • Note: If you changed the PW to use the manual sync, the PW on the Live page will also update. 


MICROPULSE FEATURES

ROTATIONAL TELEMETRY

Why is this feature useful?: Rotational Telemetry is used in situations where downhole conditions are likely to inappropriately trigger the flow switch in the downhole tool. Some examples include loss of circulation or gas flowing past the MWD tool.

How it works? Rotational Telemetry does not use ‘flow-off’ to trigger survey capture and ‘flow-on” to trigger survey telemetry. When rotational telemetry is enabled, flow is ignored completely. Rotational Telemetry abides by standard dynamic sequence settings, such as Mode Matrix, Rotation Evaluation Time and Rotation Threshold.

  1. Rotation state going from Not Rotating to Rotating – This trigger allows the tool to begin telemeter-ing data starting with configured Survey Sequence followed by the Rotating Sequence.
  2.  
  3. Rotation state going from Rotating to Not Rotating– This trigger makes the tool re-synchronize and send Non-Rotating sequence while taking continuous surveys in the background. The MicroPulse saves the least noisy survey in RAM and uses the same for telemetry / transmission with the next Low to High transition of its rotation state.

Since this feature would primarily be used in non-ideal circumstances, it is important to note the following:

  • Once the MicroPulse tool begins telemeter-ing data it would continue to Pulse / Telemeter until it loses power when Rotation Telemetry Mode is enabled.
  • Flow Downlinking is disabled when the tool is in Rotation Telemetry Mode. Rotation Downlinking option is still available to customers, if desired.
  • Dynamic sequences will be automatically enabled by Eclipse Touch when Rotation Telemetry Mode gets enabled. So, it is important to make sure the user configures the Mode Matrix, and selects Rotating and Non-Rotating Sequences.
  • See below pics for enabling Rotation Telemetry Mode and important settings regarding Rotation Threshold and Rotation Evaluation Time settings.


  •  
  •  


ANALYSE BUTTON

Why use it? Often energy companies require certain data density, or directional drillers request tool face updates within a certain amount of time. Analyse is a good tool to determine if the way you’ve written your sequence meets all requirements.

What does it do? The Analyse button is used to estimate footage or elapsed time between data points, based on ROP and sequence.

Exercise: Directional driller requires a toolface every 20 seconds or less, there is also one gamma point required for every 1.5 feet drilled. You also need to include AZI gamma up & down, SVLs and a .8 second pulse width. Use the Eclipse Keyboard and Analyse tool to build a configuration that accommodates the needs.


PULSE OVERDRIVE

Why use it? The purpose of Pulse Overdrive is to increase pulse amplitude without sacrificing data rate. In situations where you would typically increase the programmed pulse width, in noisy or deep environments, you can turn on pulse overdrive to prevent downlinking to a slower data rate. Additionally, you can preemptively decrease your programmed pulse width and enable Pulse Overdrive so that your Pulse Overdrive pulse, will match the programmed pulse width you typically run in a section. In this scenario pulses will be similar in size, but rest time(the time between pulses) has decreased, data rate will speed up. Both scenarios are changing the same settings, just two different strategies of using the same feature.

How does this work? With standard M-Ary, when the pulse width is increased so does the time between pulses (aka “Rest Time”). Increased pulse width increases the amount of time it takes to telemeter a sequence.

Standard M-Ary Encoding:


  • Peak to peak measurement is always 1.5x of the pulse width
  • The wider the programmed Pulse Width, the more elapsed time per telemetered mnemonic
  • Downlink to increase PW (increase closed timing valve to generate stronger signal or greater pulse amplitude)


  • Decouples width of pulse and spacing in between pulses
  • Increases pulse amplitude without sacrificing time
  • No changes in decoder settings needed to sync


RESYNC

Why use this feature? The purpose of resync is for situations when intermittent loss of pulses results in the loss of synchronization. Resync gives Eclipse Touch an opportunity to re-synchronize without cycling the pumps.

How does this work? Resync tells the MicroPulse to telemeter sync pulses at the beginning of every iteration of a Toolface Logging sequence.


SHOCK AND VIBE LEVELS

Why Shock and Vibe levels are an important metric: Live shock and vibe readings provide for real-time tool health monitoring. Sometimes telemetering full scale shock and vibe data, amongst other data requirements, can be burdensome. The purpose of shock & vibe levels is to maximize the amount of info telemetered to surface in the smallest number of bits.

How does this work? The packed mnemonic used to telemeter shock and vibe levels is SVL, which is 8 bits, found in the MWD Keyboard.


There are 4 levels of shock and vibe: 0, 1, 2, 3. These levels are meant to use visual cues to indicate shock and vibe severity. 0 is green (low), 1 is yellow (moderate), 2 is orange (high), 3 is red (extreme).

Note: The user can set the values for the levels on the Shock and Vibe tab of the Editor in Eclipse Touch. Below are the recommended values for levels. These should be the default values in a fresh installation of Eclipse Touch.


Shock: 0G-40G-60G-80G

Vibration: 0Grms-5Grms-10Grms-15Grms

The proper mnemonic to be written into the sequence is ”SVLs:u8:P”, and can be found on the MWD Keyboard, labeled “R/Y/G”, which stands for the colors red, yellow, and green on the Live Page Shock and vibe indicator.


When decoding, the Live page Shock and Vibe Indicators should illuminate according to the value decoded.


ECLIPSE TOUCH MEMORY FILES

How do I find them? To access all the below files, you must follow the below file path: C:\ProgramData\Erdos Miller\Eclipse Touch\Wells

If you cannot locate the Program Data folder it may be hidden. Open File Explorer > Options > View Tab > Select “Show hidden files, folders, or drives”


Once you’ve located the Wells folder, select the well you want to collect data from.


DECODER LOGS

Why are they important?: Often decoding issues are encountered in the field, and the raw pressure data is needed to analyze the data to look for bugs, assist in troubleshooting, and/or decoder improvement.

What are they?: A Decoder Log is a file designed to contain the bare minimum amount of information, which includes:

  • All the configuration information configured to Eclipse Touch at the time the file was generated.
  • Well Name
  • Run Number
  • Pressure data
  • Pressure samples:

- Samples are stored at either 250 Hz (samples per second) or 1,000 Hz
- Resolution of Decoder Logs is dependent upon which computer the eDAQ is plugged into.
- The computer which the eDAQ is plugged into stores Decoder Logs at 1,000 Hz
- All other computers on Local Sync, which the eDAQ is not plugged into, stores DecoderLogs at 200 Hz

More information:

        • Eclipse Touch only logs Stand-Pipe Pressure from the pressure transducer when stand-pipe pressure meets or exceeds the set Pumps-On Threshold. When the pressure falls below the Threshold, Eclipse Touch stops logging Stand-Pipe Pressure.
        • Eclipse Touch stores configuration data and pressure samples in Decoder Logs.
        • Eclipse Touch assigns a number to these files consecutively based on the pumps cycle, or periods of time in which pump pressure is above the Pumps-On Threshold. When Pump Pressure falls below the Threshold, then increases to or above the Threshold, the file generated is given the successive number.

Location:

    • Decoder Logs can be located by the following file path:

      C:\ProgramData\Erdos Miller\Eclipse Touch\Wells\[your well name]\[current run number]\Decoder Logs

Naming Convention:

  • Example: S0001_2024-01-15-22.31.43.712
  • S0001_2024-01-15-22.31.43.712”
  • “S”, which is an acronym for “Stand”, this is the term used to refer to file(s) with the same number, from the same job, well and run.
  • S0001_2024-01-15-22.31.43.712
  • At the moment the Pump Pressure meets or exceeds Pumps-On Threshold Eclipse Touch uses the system time to create a time stamp used in the file’s name using the following format YYYY-MM-DD-HR.MN.SS.MS
  • S0001_2024-01-15-22.31.43.712
  • All Decoder Logs are given a 4-digit number, which increases in numeric order every pump cycle. A newly generated file will be assigned the successive number from the last pump cycle or “S” number. Example: (See next pic)
            • - If this is the first Decoder Log created on this computer, or the logs and wells have since been deleted, the file will be given the number “0001”, as shown in the example.
            • - If the pump pressure remains above the Pumps-On Threshold for longer than approximately 10 minutes, Eclipse Touch creates a new file with the same Stand Number, but newer time stamp. The time stamp will reflect the system time when the new files were created.
          • Example: S0001_2024-01-15-22.31.43.712
          •  


APP EVENT LOGS

Why are these logs important?: When software issues are encountered, it’s important for our software developers to have the ability to understand what events led up to the issue. These logs greatly aid in the troubleshooting of software bugs.

What’s in these logs?: The App Event Log contains processes performed by Eclipse Touch, which gives the software developers the ability to see the processes happening in the background and stores general information of processes being executed by Eclipse Touch. An Apps Event Log is created every time Eclipse Touch is launched.

Location:

  • Apps Event Logs can be located by the following file path:

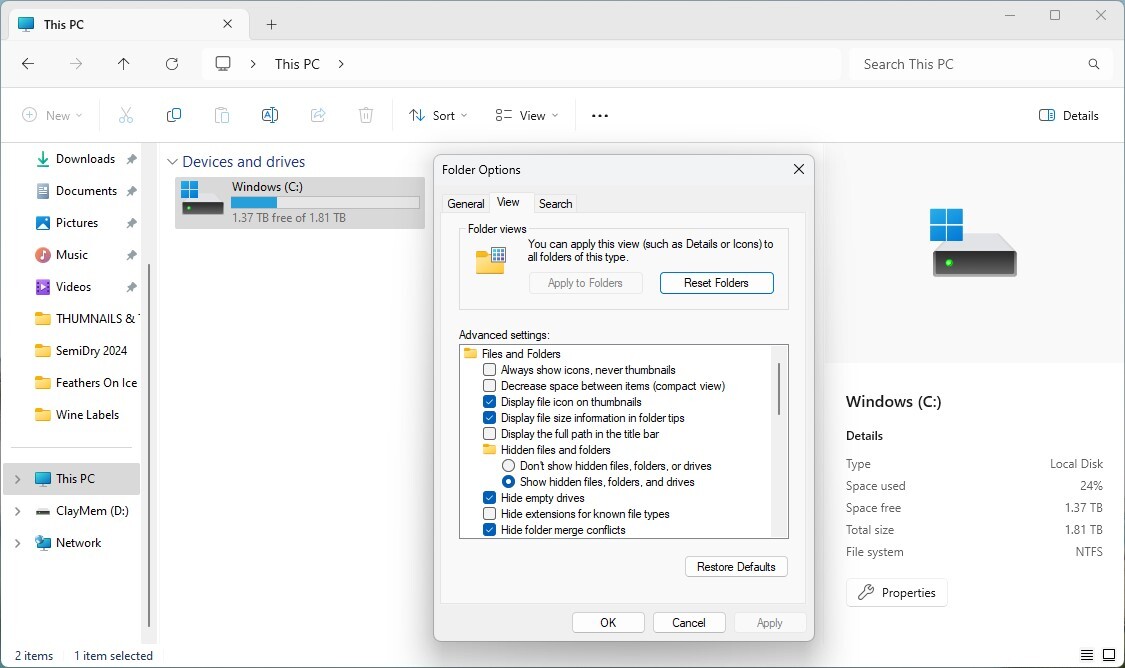
C:\ProgramData\Erdos Miller\Eclipse Touch\Wells\[your well name]\Diagnostic Logs\Apps Event Logs

Naming Convention:

  • Every Apps Event Log’s name begins with “EConf”, which indicates the file type. EConf7.19.0_2024-02-14-08.17.59.614
  • When Eclipse Touch is launched, the system time is inserted in the name of the file EConf_4.7.19.0_2024-02-14-08.17.59.614
  • The version number of Eclipse that was launched is inserted into the name of the file EConf_7.19.0_2024-02-14-08.17.59.614

ASC EVENT LOGS

Why are they important?: ASC Event Logs records data for the purpose of troubleshooting ASC.

What is in them?: ASC Event logs contain processes done under the umbrella of the API known as Automatic Survey Corrections and Eclipse Touch and the survey corrections provider.

Location:

  • ASC Event Logs can be located by the following file path:

C:\ProgramData\Erdos Miller\Eclipse Touch\Wells\[your well name]\Diagnostic Logs\ASC Event Logs

Naming Convention:

  • The naming convention of ASC logs are just a time stamp of when the log file is created. An ASC log is created once the “Fetch Wells” button is selected, and a new file is created when the log has reached the maximum size of 1KB.
  • Example: 2024-02-14-08.17.59.614

Contents:

  • ASC Events Logs contains a log of events related to the process of Automatic Survey Corrections


PHM FILE

PHM File (Pulse History Model)

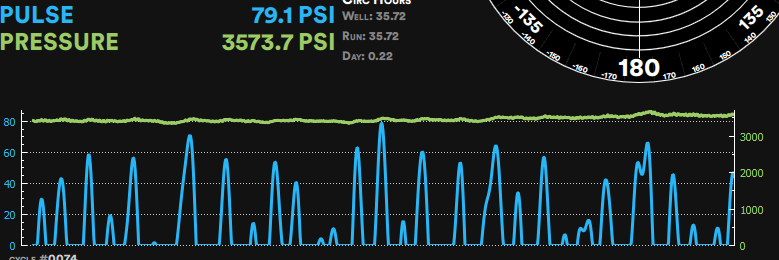
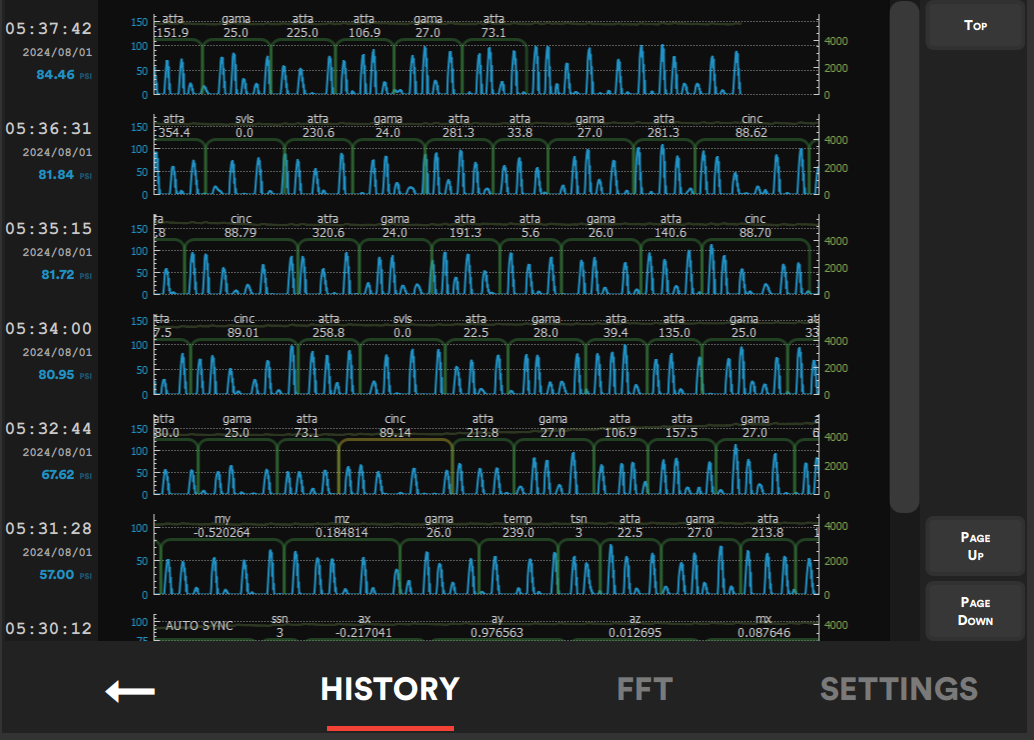
What’s the purpose?: The PHM file loads the image of previous pulse history when Eclipse Touch is closed and re-launched.

What is PHM?: PHM is an acronym for Pulse History Model. This file retains the image of your pulses in the pulse history view, which gives the software the ability to return the pulse history after closing and relaunching the software. PHM file is an SQL database, storing pressure data point across time, to provide an accurate illustration of the waveform history.

Location:

  • The PHM File can be located by the following file path:

C:\ProgramData\Erdos Miller\Eclipse Touch\Wells\[your well name]

Overview:

Naming Convention:

  • This file is simply named “phm.db” and is stored in the route well folder


DB FILE

What is a DB file?: The DB file is how Eclipse Touch stores well related data, such as well specific data, runs and associated times, decoded data and some configuration data. The DB file is an SQL database which stores records and datapoints captured by Eclipse Touch during the duration this job was set as active. The DB file can be viewed with software such as SQL Viewer.

Location:

  • DB Event Logs can be located by the following file path: 

C:\ProgramData\Erdos Miller\Eclipse Touch\Wells\[your well name]

Naming Convention:

  • This file name is the well name followed by .DB


CONFIGURATION AND TESTING

ACCESING THE CONFIGURATION IN THE MICROPULSE AND THE DECODER

Pulling Config from MP or Decoder

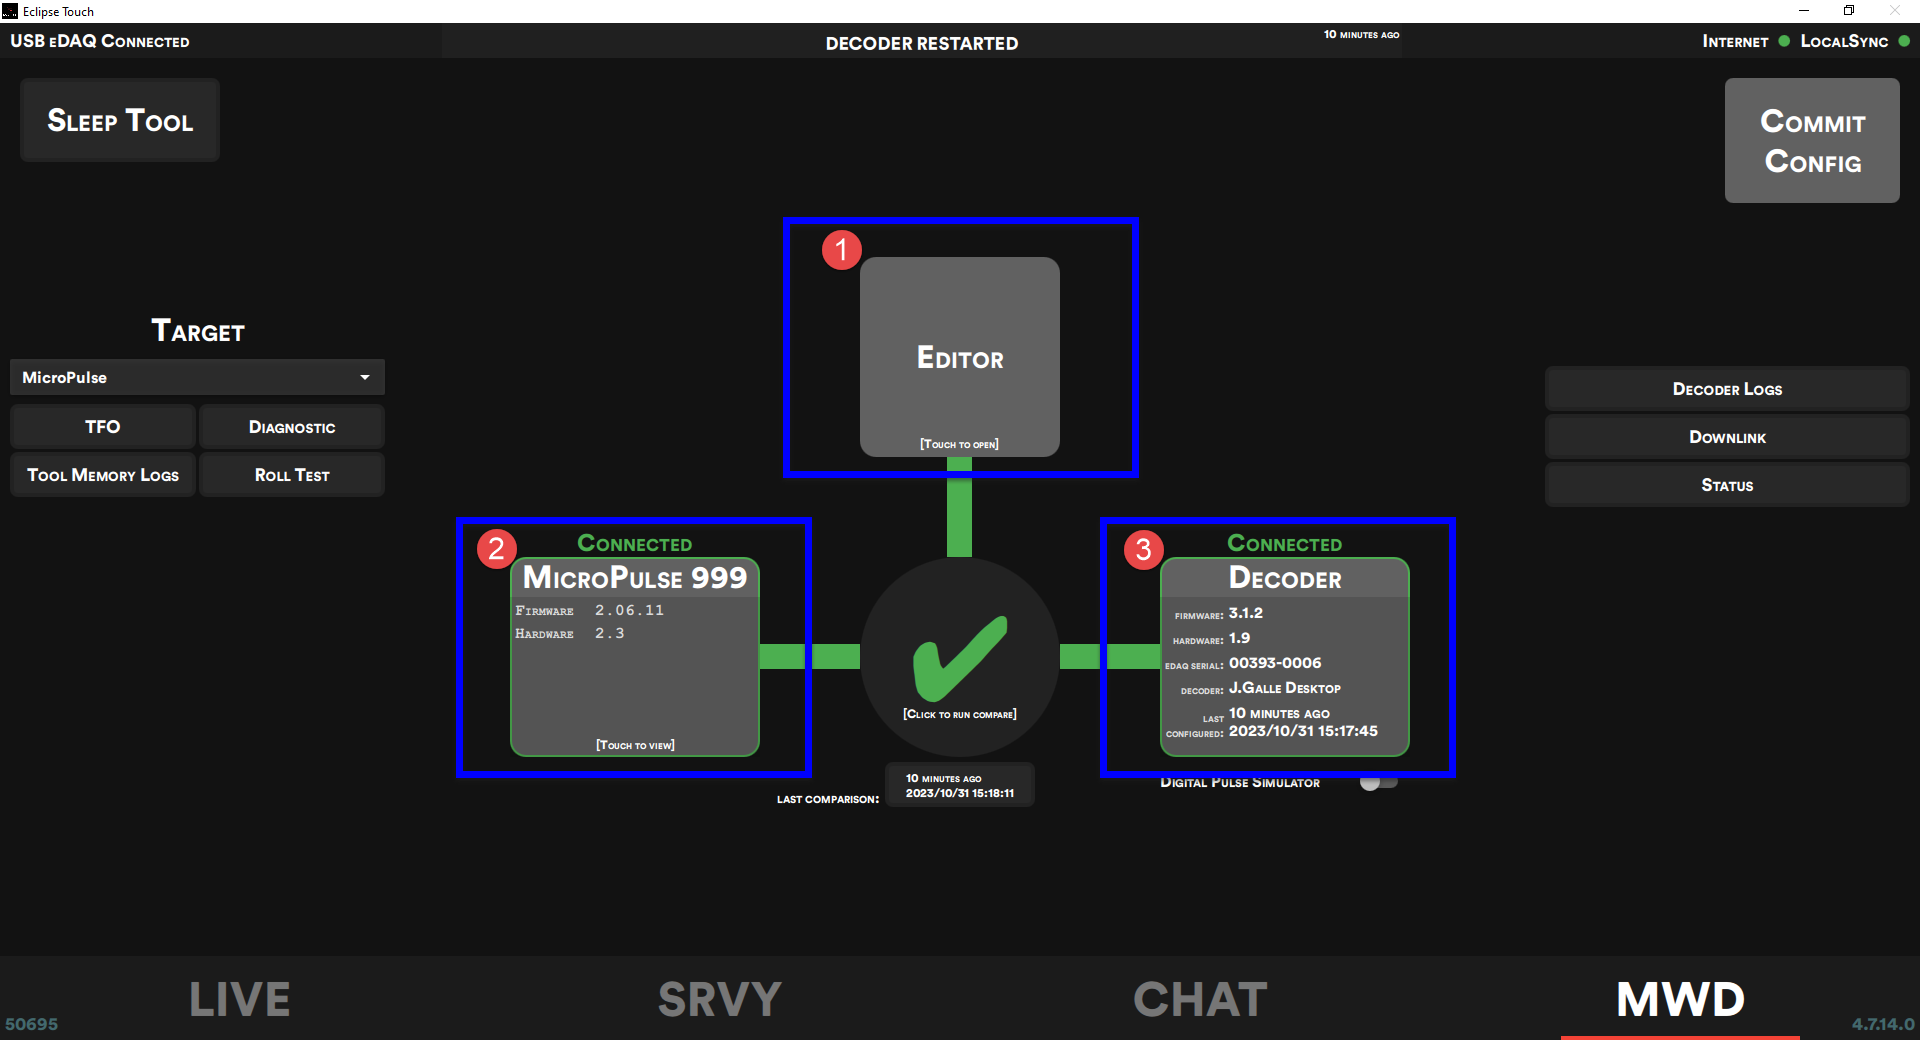
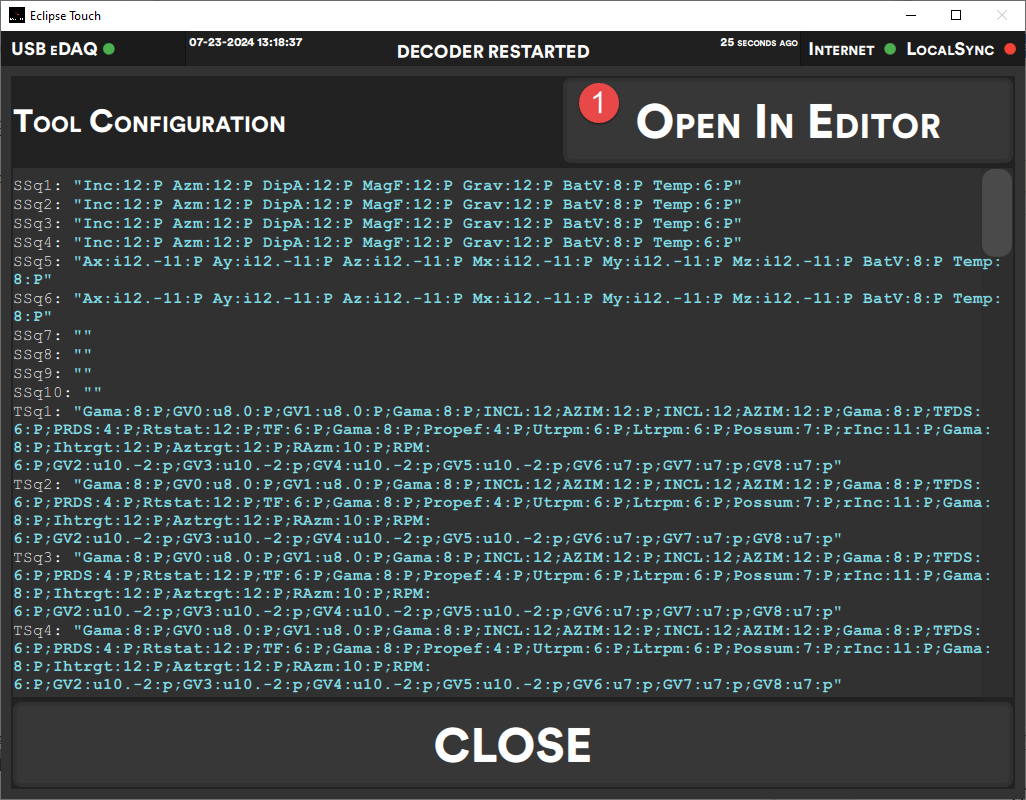
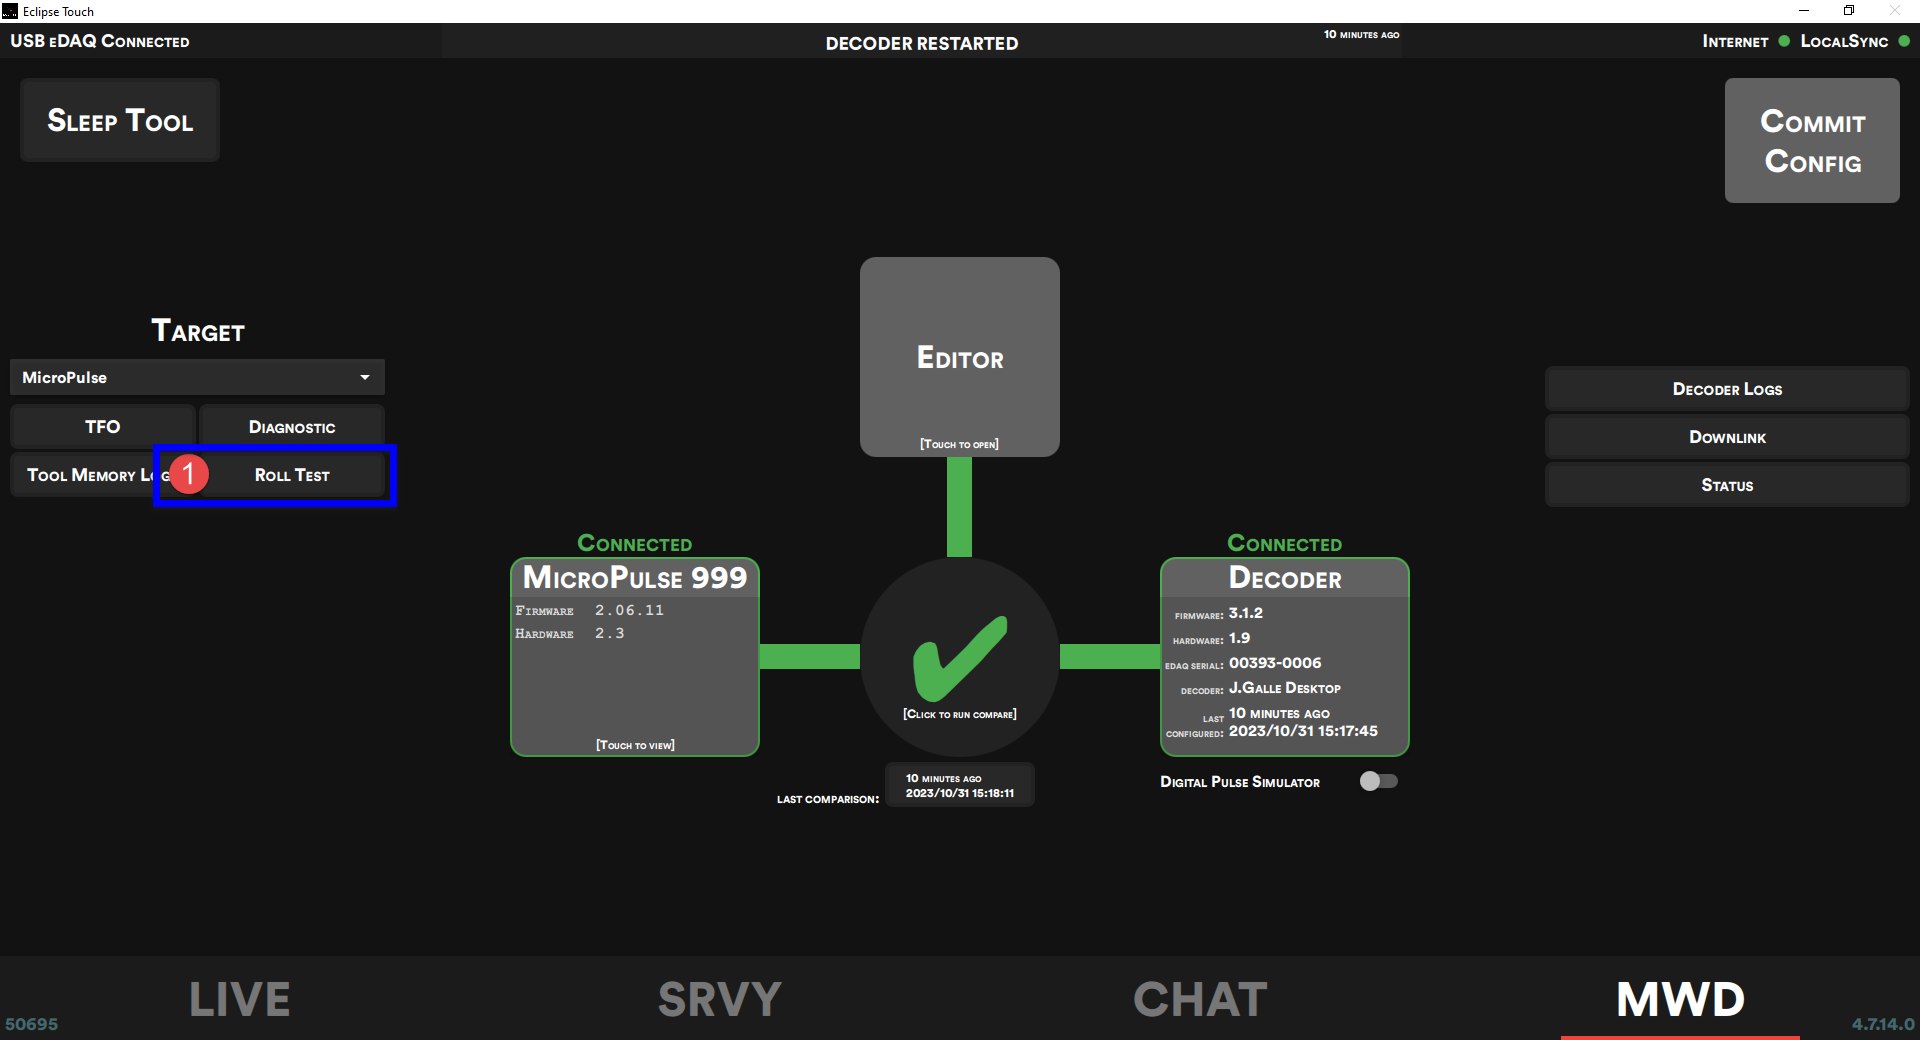
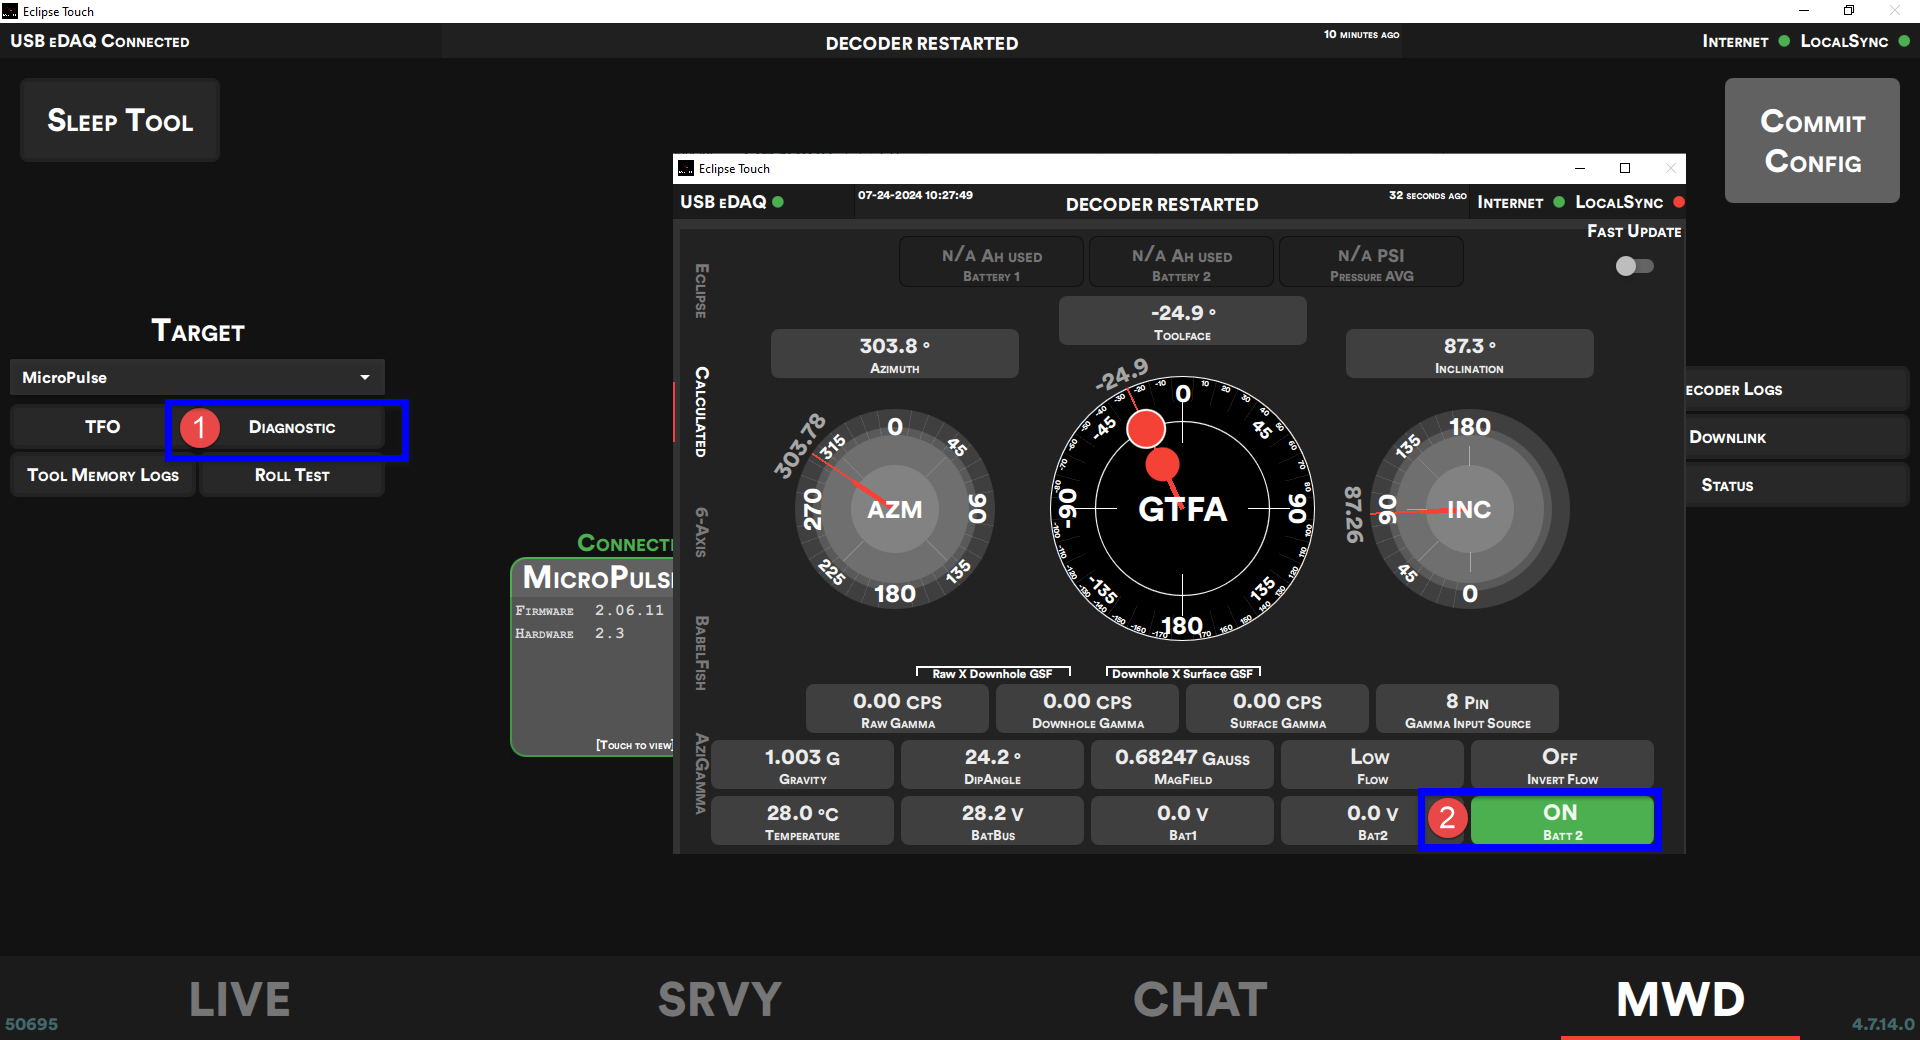
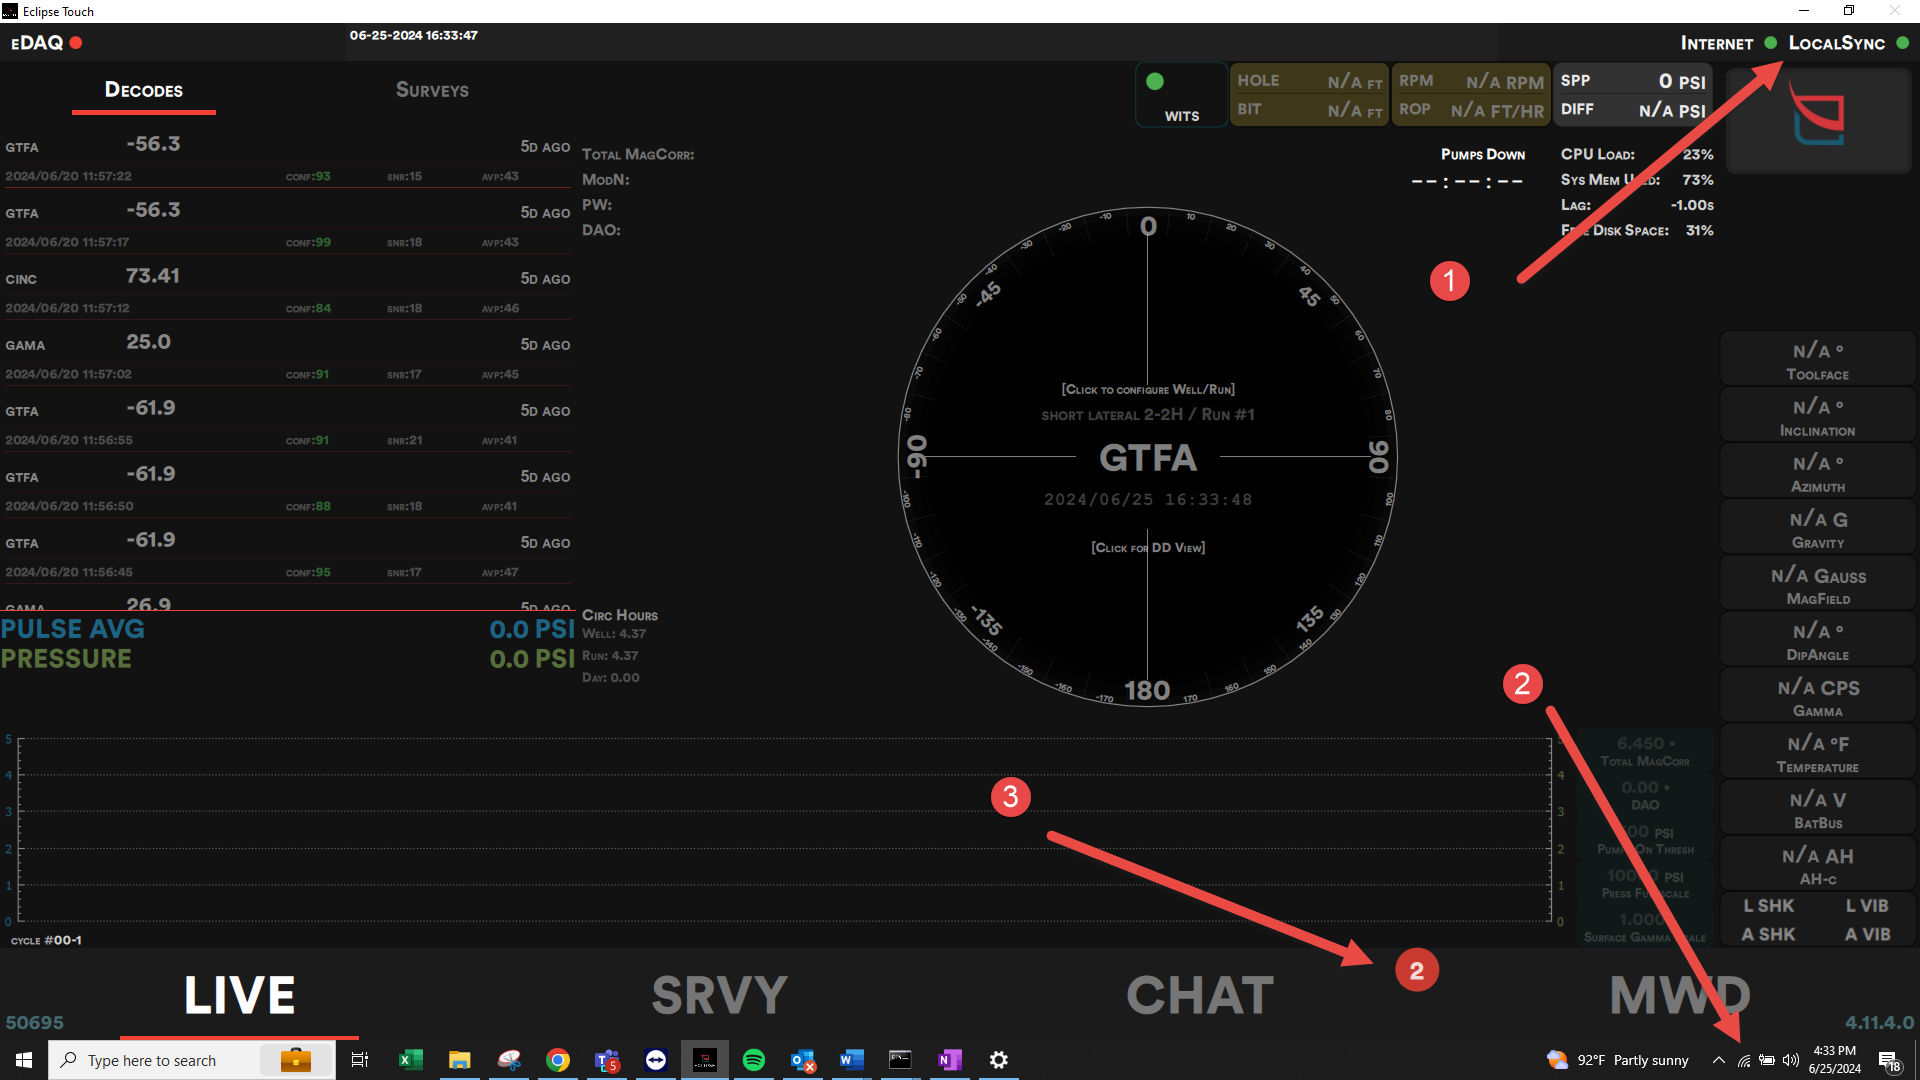
When programming a tool with Eclipse Touch, a new MWD Configuration file can be designed by clicking on the “Editor” button (1)., or the MWD configuration that is in the MWD tool or the Decoder can be pulled into the editor by pressing on the “Tool” button (2), or the “Decoder” button (3)


When the “Tool” or “Decoder” button is clicked it will open a window where the stored config can be viewed in text format (see below). When the “Open In Editor” button (1) is pressed it will open the Editor with the configuration settings that are shown in text.


TARGET

The “Target” setting, located at the top of the “General” tab in the “Editor” allows user to select which type of tool they wish to decode or program. Selecting the correct tool type is important because Eclipse Touch (ET) will display different setting options depending on which target is selected. ET can decode many MWD tool types including Noralis, Benchtree, Tolteq and Blue Force.


qBUS/qMIX

qMIX is a Communication Protocol that is used on the qBUS and is a predecessor to newer protocols such as CAN BUS.

There are several devices on the market that can augment a GE/Tensor compatible MWD string by taking advantage of the qBUS, which allows communication between these devices and the MPU. Examples of information available through the qBUS interface include surveys, battery voltage, and flow state. These devices may also store values to the MPU, which are transmitted to the surface in survey or telemetry sequences. Variables available for such use are called generic variables (GVs).


The qBUS can have many nodes but only one controller, or master. A node does not assume qBUS mastership and waits to be polled by the master. If there is no probe in the string that will assume qBUS mastership, then no communication will take place. When MicroPulse is configured as the controller it will poll other nodes for data. A good example of this is getting battery voltage from a smart battery.


GAMMA SET UP

 Gamma Setup Mode:

Simple Mode keeps things simple; gamma input pin is defaulted to Pin8, and the gamma downlink feature is disabled.
Advanced Mode allows the user to assign the gamma input pin according to how it is setup in the lab, eg Pin-8, Pin-11 or Pin-12. The gamma downlink feature will also be enabled when advanced mode is chosen. Gamma Downlinking allows the user to switch between gamma input lines (8,11, and 12).

  • Gamma Scale Factor – Scale factor for standard Omni/Bulk Gamma Measurements.
  • AziGamma Scale Factor – Scale factor for azimuthal gamma measurements.
  • Gamma Input – Defines the directional module input pin receiving counts from the gamma sensor. Pin-8, Pin-11 or Pin-12


BAUD RATE

The “CAN Baudrate” setting is located at the bottom of the “General” tab in the “Editor”. This sets the CAN Bus communication speed on the Micro Pulse. For normal operations the default CAN Baudrate of 500Kbit should be used. When using a Babelfish translator in the string the CAN Baudrate should be set to 125Kbit. ET automatically changes this for you when Babbelfish/RSS mode is selected.


DYNAMIC SEQUENCES

When using ET with MP, Dynamic Sequences can be enabled. Dynamic Sequences allows the MWD tool to send a Non-Rotating Tool Logging Sequence when sliding and a different Rotating Tool Logging Sequence when rotating. This allows for greater flexibility in programming and greater data resolution while rotating since ATFa’s can be removed when they are not needed during rotation.

To enable this feature, navigate to the “Mode Matrix” tab of the “Editor” and click the radio button under “Dynamic Sequences”. Once enabled ET will allow the user to assign Rotating and Non-Rotating Sequences. When using this feature, it is necessary to insert RotW:P into both Non-Rotating and Rotating Sequences. The RotW:P transmits a change in the rotation state of the tool and allows the surface system and MWD tool to stay in sync.


ROLL TEST

Start by: Clicking on the “Roll Test” button (1), this will open the roll test wizard.


  • When clicking on the roll test button a window will pop up giving the user the option to choose either a field or a lab roll test.

  •  


When choosing to do a field roll test the user is given the option of choosing a 4- or 9-point roll test. The user then will be asked to choose between Manual mode and Assisted mode. Manual mode requires the user to manually take roll test shots by pushing a button. Assisted mode takes the roll test shot automatically once the desired target is met and the tool is still long enough to register as "stable".

In the event of a failed roll test, the area around the tool should be inspected for any metal that may be interfering with the magnetic field. The tool can also be repositioned on the stands so that the DM is supported on both sides.


1

Progress Bar

Displays the progress of the roll test.

2

Stable Button

Turns green once a measurement is ready to be recorded either automatically or by using the "Take Measurement" button if doing a manual test.

3

Audio Feedback Button

Turns "Audio Feedback" option on and off. Audio feed back plays a repeating "sonar" signal that speeds up as the target tool face direction is reached.

4

Telemetry Display

Displays target inclination and current INC and AZ Measurements.

5

Tool Face / Shot Display

Displays the TF of connected tool. Also indicates which shots need to be taken with red triangles that turn green once the shot is taken in that position.

6

Survey Shot Display

Displays data from shots taken.

7

Redo Button

Removes the last taken measurements so it can be retaken.

8

Finish Button

Completes the roll test, displays if roll test passed or failed and displays report.


BATTERY ASSIGNMENT

 The MWD tool and batteries can be configured in three ways. The below image illustrates the battery number assignments in each configuration. This is important to know so that the highest hour battery can be placed as battery 1.


By default, Eclipse Touch turns Bat2 on, which means that batteries are set to run in parallel and allows the tool to draw power from both batteries at the same time. Bat 2 can also be turned off, which allows Bat 1 to be used until it drops below a set threshold and turns Bat 2 on. Bat 2 can be turned off using the “Bat 2” button (2) which is located on the “Diagnostic” page(1) on the MWD tab.


DIGITAL PULSE SIMULATOR

How to use the Digital Pulse Simulator

Once the MWD tool is programmed you can use Eclipse Touch’s “Digital Pulse Simulator” to simulate flow and test the performance of the MWD configuration loaded. The Digital Pulse Simulator can be used to test a full MWD string or just the MicroPulse. If the Can Communication box is powered no batteries are needed to test the configured settings.

The Digital Pulse Simulator is activated via toggle button on the MWD tab (1). Invert Flow will need to be enabled if the tool is not being vibrated to simulate a high-flow state. Invert Flow can be turned on by accessing the Diagnostic window by pressing the “Diagnostic” button (2).

Once the Digital Pulse Simulator is turned on and High Flow is being simulated through Invert Flow or vibration, the performance of the loaded configuration can be viewed by navigating to the “Live” screen.


LOCALSYNC AND CONNECTIVITY

Networking and Connectivity

This section will show how a typical network is set up on an Eclipse Touch job, give an overview of networking terms and concepts, and explain how to use available tools to diagnose issues.

The diagram below depicts the standard rig site set up when using Eclipse Touch and Erdos Miller supplied Ubiquiti antennas. Every piece of this equipment needs to be functioning and configured correctly so that ET can achieve a LocalSync connection.


There can be many causes of LocalSync issues, there can be software version and setting issues (ET, Windows, firewall, anti-Virus), incorrect network settings, or hardware issues (equipment, cables, connections). Fortunately, there are many tools at our disposal to help us diagnose where the problem is in our network. The tools we use will be found in Eclipse Touch, various Windows settings, and the Ubiquiti antenna dashboard.

Important Note:
Always make sure the same version of Eclipse Touch is installed on the RFD and MWD computers. Running different versions can cause a multitude of issues.


BASIC NETWORKING

OVERVIEW OF NETWORK TERMS

Here is a list of basic terms we will need to know when diagnosing LocalSync issues. The definitions will reference the below image.


*Dotted-Decimal Format – is the format that IPv4 addresses, Subnet Masks, Default Gateways and other networking items are displayed in. This is a way of displaying a 32-bit number that is formatted as four 8-bit fields that are separated by periods (000.000.000.000). Each section can have a value of 0-255.

IP Address – 192.168.84.46 It is a unique address that identifies a device on the internet or a local network.

Subnet – A subnet, or subnetwork, is a network inside a network. In the above example the subnet would be anything from IP 192.168.84.1 – 192.168.84.255.

Subnet Mask – 255.255.255.0, This allows the subnet a range of 256 usable IP addresses. Since it can only use the very last field, the (0), to assign IP addresses.

Default Gateway – 192.168.84.1, A default gateway is the network node, usually a router and acts as the front door to the rest of the connected networks to let traffic in and out of your network. In this use case, it also tells you the IP needed to access the Ubiquiti antenna dashboard.


ECLIPSE TOUCH

Live Page Indicators at First Glance

The first indication that there is a LocalSync issue should be (1) the Internet and LocalSync indicators on the Eclipse Touch Live page. Chat messages (2) can indicate a change in LocalSync state. The network connections icon (3) on the Windows Task bar is a quick way to check if the ethernet connection status has changed.


The ethernet connection will show at the top of the menu and should populate with a name if connected, it is expected for it to say “No Internet” on this connection since it is a closed network.


Chat Page

The chat page on ET can also provide important information regarding LocalSync connectivity and identifying this computer or connected peers. "The "Reset" button (3) can be used to terminate all existing connections. This can be a useful step for attempting to resolve connection problems."


1

Connected Peers

Shows the name and status of any connected PCs.

2

Number of Peers Connected

Displays the number of connected peers.

3

Reset Button

Resets networking properties for this instance of Eclipse Touch.

4

Chat Messages

Displays chat messages.

5

Name of This PC

Displays the current name of this PC in Eclipse Touch.

6

Name Change Button

Allows user to change the name of this PC in Eclipse Touch.

7

Peer IPs

IPs of those connected via LocalSync

8

Chat Message Target

Drop-down menu to select message target when multiple peers are connected.

9

Chat Text Entry Window

This is where chat text is entered.

10

Send Button

Sends the chat message to the intended target.


UBIQUITI ANTENNAS

The Ubiquiti Antennas have LEDs that offer some easy visual diagnostics. Here is a description of each of the LEDs on the outside of the antenna.


Ubiquiti also offers a fully operational dashboard where connection, signal strength and network settings can be checked.

To access the Ubiquiti Dashboard, you need to enter the IP address of the antenna into the internet browser of your choice. The default IP address for Erdos Miller configured Ubiquiti antennas is 192.168.84.1. This was mentioned earlier and can be easily found by running an ipconfig command in Window’s Command Prompt and then using the Default Gateway of the Ethernet connection. Most browsers will try to protect you from going to that IP address, you will need press the “advanced” button then click on a “proceed to 192.168.84.1” link. This will land you at the login screen for the Ubiquiti Dashboard, you will need credentials to log in. The default Erdos Miller credentials are:

Username: ErdosMiller

Password: EmNBE2009

Warning: Take care not to change any settings. This dashboard is a great troubleshooting tool, but it also allows access to core network settings that should not be changed.

The initial screen shows the signal strength and name of the MWD antenna (1) and the RIG antenna.


WINDOWS AND NETWORK SETTINGS

Running the “ipconfig” command in a Windows Command Prompt window is a valuable tool for diagnosing networking issues. To do this, press the “r” key and the windows button at the same time, then type “CMD” in the window that pops up. This will bring up Command Prompt window. In the Command Prompt window, type “ipconfig” and press enter. This will bring up the following information.


PING

If we use the above steps on both the shack and rig floor computers. We can attempt to communicate across the antennas by using the “Ping” command. A ping sends 4 packets of information to a specific IP address, then asks for 4 replies. This is very useful, if successful it will tell us we have a “good” network connection, and the issue must lie in software or firewall settings.


ETHERNET IS MISSING

If ipconfig does not display an Ethernet adapter, this means it is either disabled or malfunctioning in the case of a built-in ethernet port. In the case of a USB to Ethernet adapter it may not be plugged in, the computer may not recognize it, or the USB socket or hub it is plugged into could be bad.

First check if the adapter is disabled, go to the search window on the task bar and search for “Network Connections”. This window will pop up and show all available network adapters. If the ethernet adapter is disabled, it will be greyed out and you can right click on it and click “enable”.


If the adapter does not show in the above window this means it is not being recognized by the computer, is not plugged in, or is broken. We can test for this by opening the “Device Manager”.


DEVICE MANAGER

Go to the search window on the task bar and search for “Device Manager”. Scroll down to the Network adapters section and click to expand the list. Then plug and unplug your ethernet adapter. If the computer is recognizing it, it should make a sound and show up or disappear from the list of adapters in the device manager.

It could also show up with a lightning bolt through the icon, meaning that the driver needs to be installed.


ADAPTER PROPERTIES

The Erdos Miller supplied Ubiquiti Antennas are configured to use Dynamic IPs. If either of the PCs network adapters are configured with a Static IP, it could cause issues. Go back to the Network Connections Window, right click on the adapter and click “Properties”.


When the properties window opens, double click on “Internet Protocol Version 4 (TCP/IPv4)”.


Double clicking on the IPv4 version will open the properties for that protocol. Make sure that Obtain Automatically is checked.


FIREWALLS

Click in the search window on the taskbar and search for “Windows Defender Firewall”, then open it. Click on the option to Allow an App or feature through.


Scroll down to find “Eclipse Config” and make sure that the three checkboxes for Name, Private, and Public are all checked. If they are not checked you can click the “Change Settings" button, this will allow boxes to be checked/unchecked. When done with adjustments, save settings.


ECLIPSE TOUCH FEATURES

DECODER SETTINGS MENU

What are Eclipse Touch Features – These features are designed as decoder settings for the site-specific application.

Why Eclipse Touch Features – The user will be able to change site, run and well specifics in this section. These are extremely helpful in the cases where pressure doesn’t bleed all the way off and gamma scale factors need to be applied before being WITS out.


image079


Once you click on any of the variables, you will get an interface prompt with all the configurable data.


image080


A description of every variable is available by clicking the information icon:


image081


Pumps On Threshold – Allows the user to set a threshold where Eclipse Touch will not register pressure below that threshold. This is a great feature for applying when the pumps initially start and the pressure fluctuates more.

Pressure Full-scale – This is based off the rating of the transducer in use, Check your transducer for its rating. When pumps are off and pressure has stabilized, the user can choose to “Zero Pressure” and Eclipse Touch will zero out the pressure and sets the pressure offset.

Total Magnetic Correction – Allows users to set the total magnetic correction being applied. This is applied to MTFA, Azimuth and Cazm. The user should check their well plan for the magnetic correction needed to be applied.

DAO – Driller Assembly Offset can be entered manually or with the DAO Wizard. The Wizard (Shown Below) will walk you through the processes of getting your DAO. It is important to make sure you measure correctly.

SGTFA TFO – Survey Gravity Tool Face Automatic, Tool Face Offset, this feature is used by Superior SQC Survey correction provider, For Hi Fi Navigation. This feature is on a per run basis, and you will input your TFO that you zeroed when you set the highside of your tool. Note – SGTFA is only available on 4.11.7 Software and newer , TFO is available for all software versions.


image082


ASC – AUTOMATIC SURVEY CORRECTIONS 

Why Automatic Survey Corrections? – This feature is made to take the manmade errors out of survey corrections. Eclipse Touch is compatible with Magvar (H&P), SQC and RoundLab.

What’s Automatic Survey Corrections? – This feature allows the user to sign into a survey corrections provider and select their well. While taking surveys, the user can automatically send each survey to the provider and when a survey is corrected it will populate in Eclipse Touch with the new corrections. This makes life simpler for the user.

By clicking the top of the compass rose on the live screen you will be prompted to the section for Survey Corrections.


image083


How to use – navigate to the “Srvy Corr” section. Hit the toggle of Automatic Survey Corrections to enable. This will enable the three providers. The information Icon (1) will give you the website, phone number and the type of corrections they provide.

Units Config (2) – This is available for H&P and SQC but not for RoundLab. You will be able to change the Units of measurement that will be sent and received.

Logging Into ASC – Choose your provider, type in your username and password, Click Fetch Wells (3) and this will bring up all the active wells (4) under that account. If you don’t see your well, you may have to scroll down to find it. Hit “Select” and that Well will be active and will be changed to green. Note- You will need to log in each time you close out Eclipse Touch.

Sending Surveys - When sending surveys to a corrections provider, you will want to enable the survey popup to enter the depth and select whether it is a check shot or a survey to submit. The Survey Popup will notify you if Eclipse Touch is not logged into an ASC Provider. Corrections should be received after the initial 4-5 check shots or surveys are submitted. Once corrections are received, Eclipse Touch will only WITs out the corrected Inclination and Azimuth.

Edit Depth / Submit Survey - If you need to edit a depth to a survey or the internet goes down and the survey did not submit to the provider, you can manually submit your survey by going into the survey tab, clicking the survey and click “Submit for Corrections” This will send the survey to the provider again. (Image Below)


image084


Notes – You have to have active internet, the correct corrections provider and Well selected for this feature to work correctly.


COMPUTER DIAGNOSTICS

Why are Computer Diagnostics Important – These stats are important to know whether the computer is in healthy operating condition. You will also know the lag time between the upstairs and downstairs systems. If your free disk space is too low, you can free up memory by deleting old wells.

What are Computer Diagnostics – There are 4 statistics shown on the live page. CPU Load, System Memory Used and free disk space all have to do with the computer performance. We will discuss each of these in detail along with how to free up storage. Your Lag is for the lag time between the two systems. We will discuss how to improve this.


image085


CPU Load – Central Processing Unit, the primary component of the computer that performs most of the processing tasks. The percentage shown is the amount of processing power that the computer is using at any given moment. The higher the percentage means the processor is handling more tasks which can lead to slower performance.

System Memory Used – often referred to as RAM (Random Access Memory), is the temporary memory used by a computer to hold data that is actively being used. If this percentage is high, you can go to “Task Manager” and see all the programs currently using RAM Space.

Lag – Is a measure of how far behind the RFD is in the processing of decoder raw data. This can cause the system to look like it is jumping information or pausing / freezing. You can restart Eclipse Touch and that should reset the lag. Adjusting antennas can also help with the lag if it is due to antennas strength between the two systems.

Free Disk Space – Refers to the amount of available storage on the hard drive or solid state drive that is not currently being used by files, applications, or the operating systems. Having sufficient free disk space is important for performance, installation of applications, files storage and system updates.

Troubleshooting Tips – to view CPU Load, System Memory Used you can go to task manager and view the applications. (Image Below)


image086


Close out applications - You can scroll through the applications to see which ones you can close out to free up RAM Space or CPU usage.

Look at your “This PC” to see your free disk space, if its low, one way you can free up space will be to delete your old wells (Contact coordinator before proceeding).

Locate Wells – to navigate to your old wells go to “File Explorer” next go to the following  C:\ > ProgramData > Erdos Miller > Eclipse Touch > Wells

Here you will see all your wells, you can choose which ones to delete depending on data and file size.